
Design your Dashboard with AI
Tutorial & Demonstration
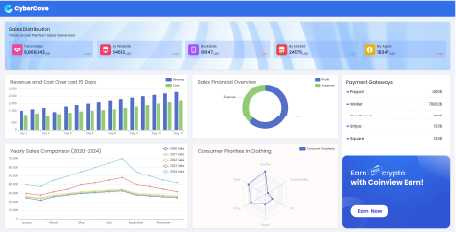
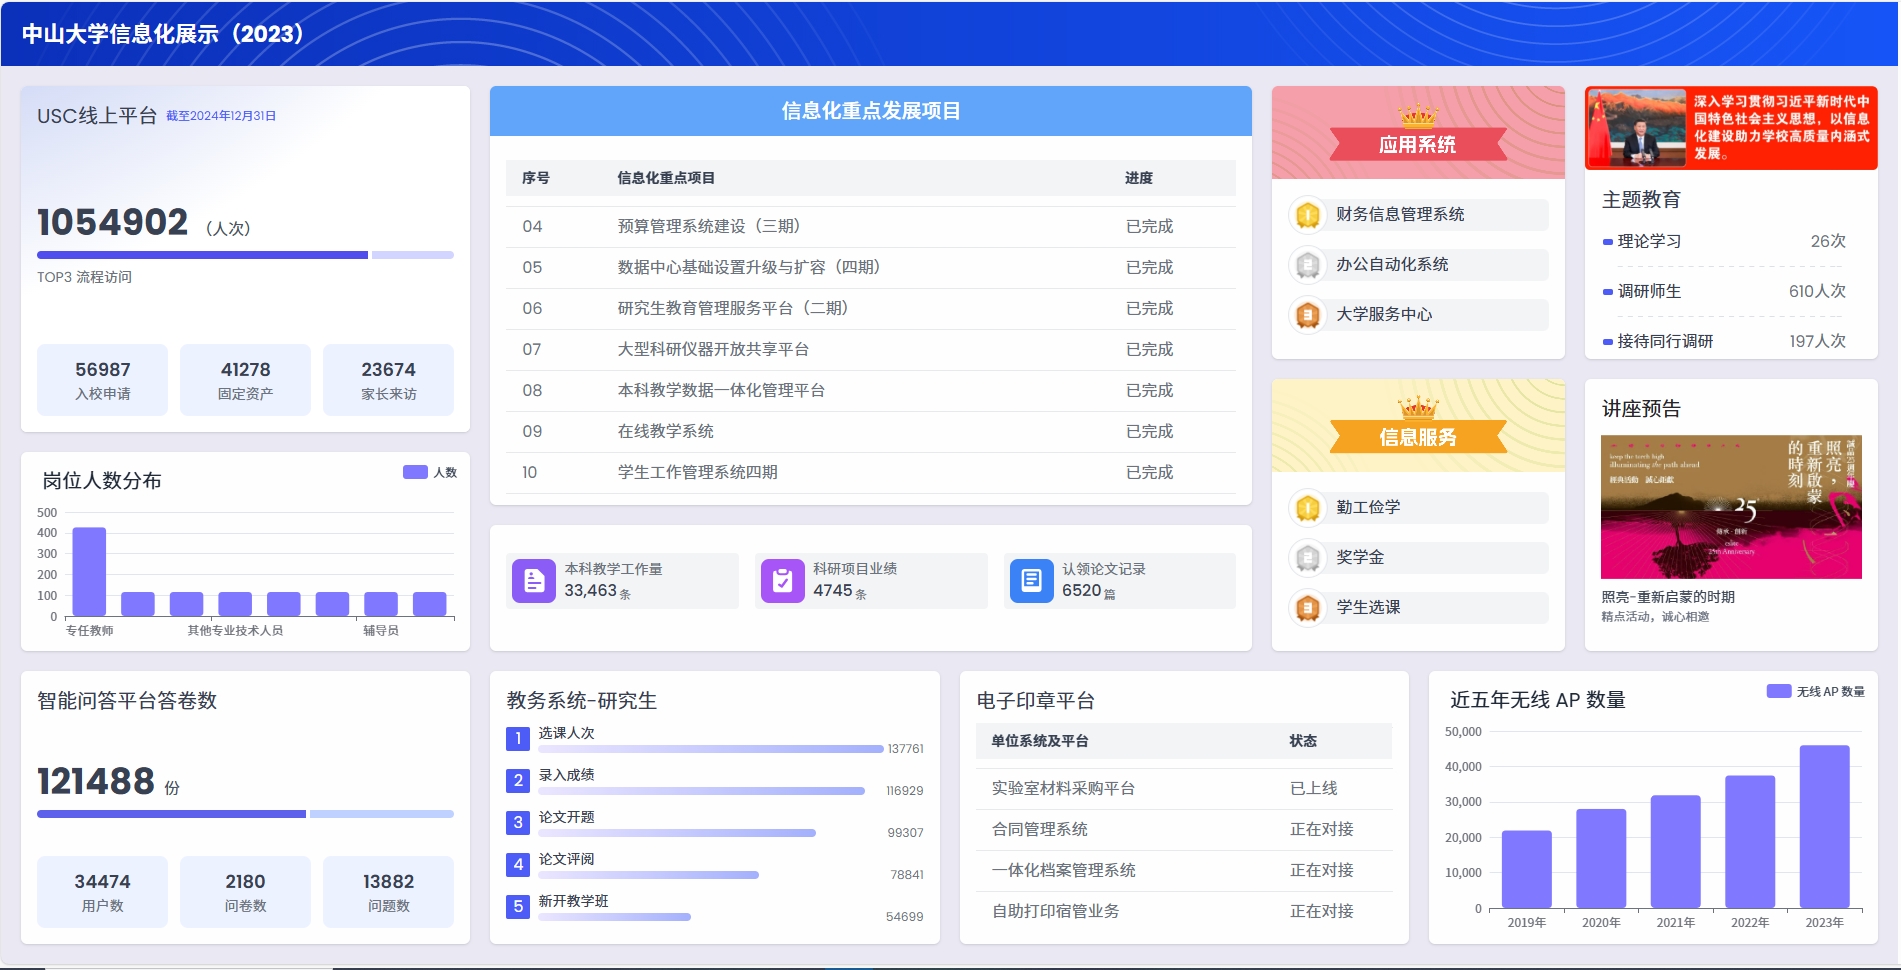
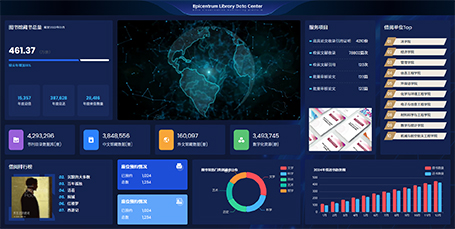
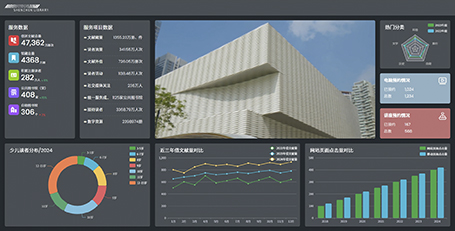
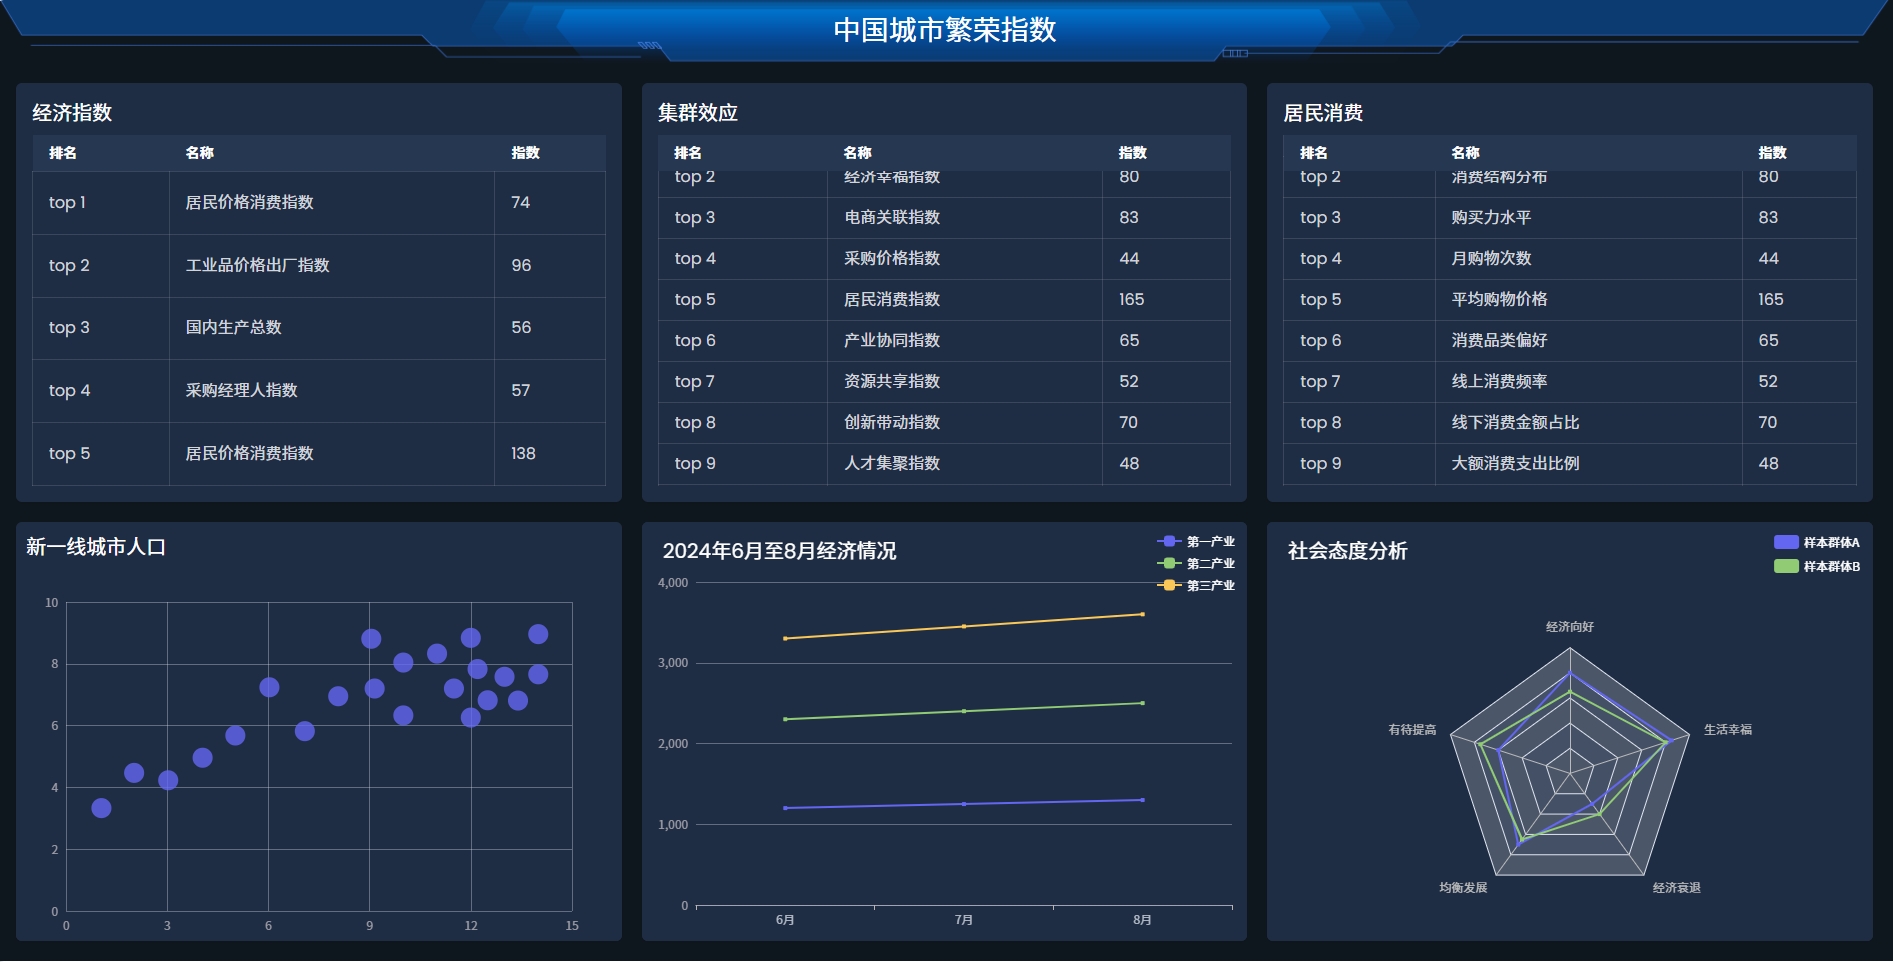
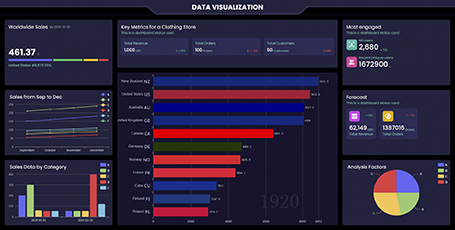
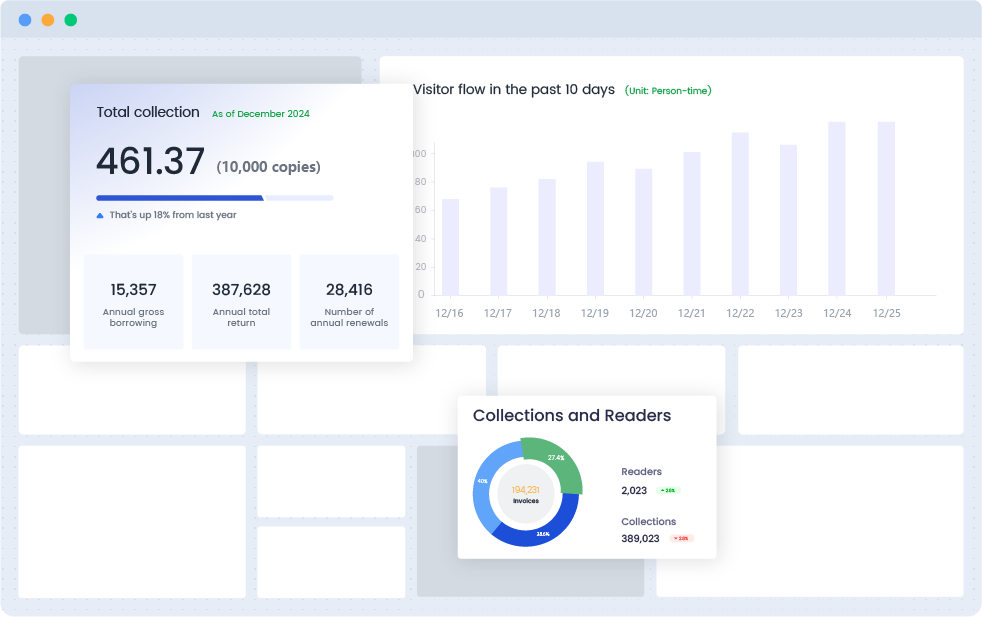
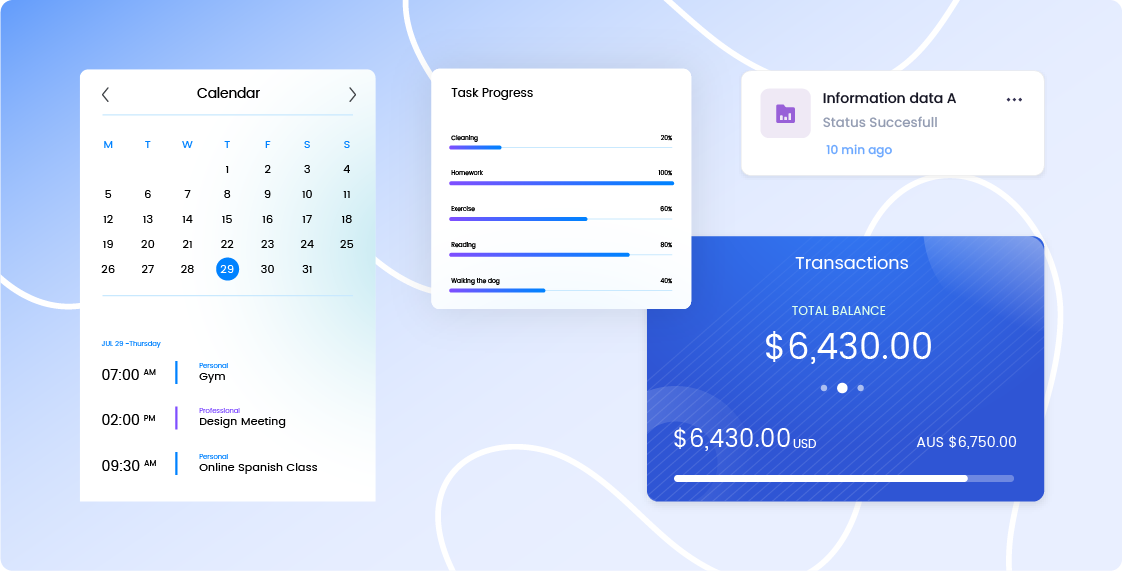
Dashboard Templates
Fancy Component
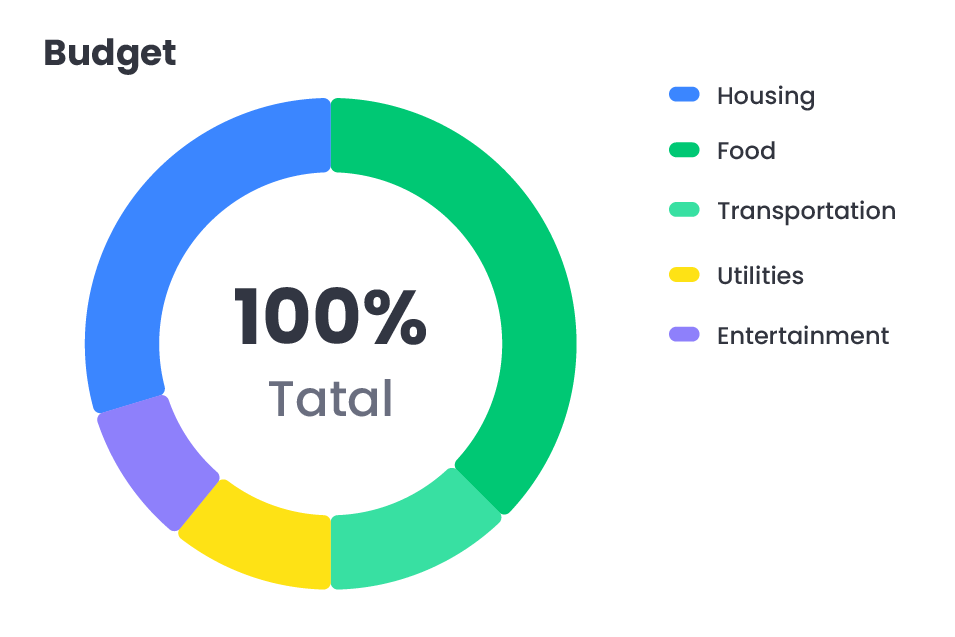
Pie Chart
A pie chart is a circular statistical graph that displays the proportion of each part in relation to the whole, highlighting the importance of specific segments. This type of graph is commonly used in market analysis, financial reports, demographic studies, resource allocation, project progress tracking, and more. With AI Graph Maker, creating pie charts is now faster and easier than ever.
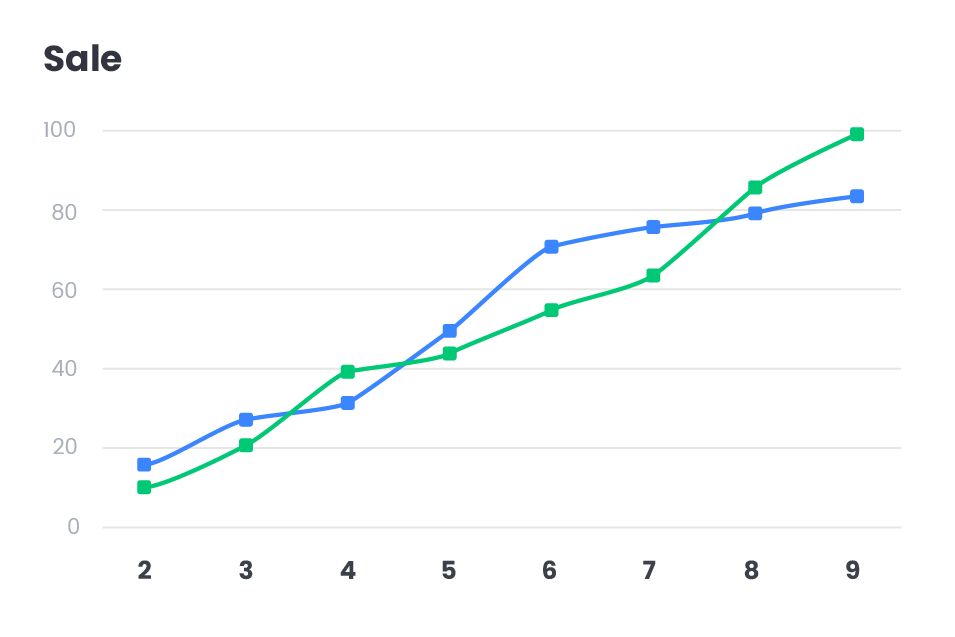
Line Chart
With AI Graph Maker, you can easily create Line Charts to visualize trends in data over time or across ordered categories. These AI-powered graph tools are widely used in various fields such as time series analysis, financial management, business operations, scientific research, and marketing. AI Graph Maker allows users to quickly understand data fluctuations and trends through clear, simple visualizations, enabling more informed and effective decision-making. Thanks to its intelligent chart generation capabilities, AI Graph Maker helps users efficiently create accurate line charts, streamlining data analysis and enhancing decision-making processes.
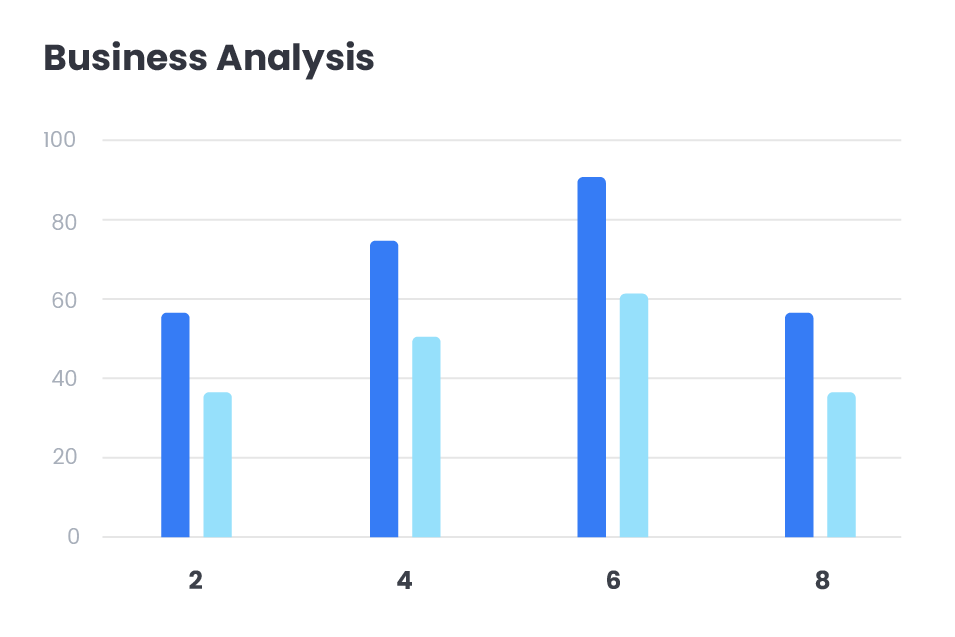
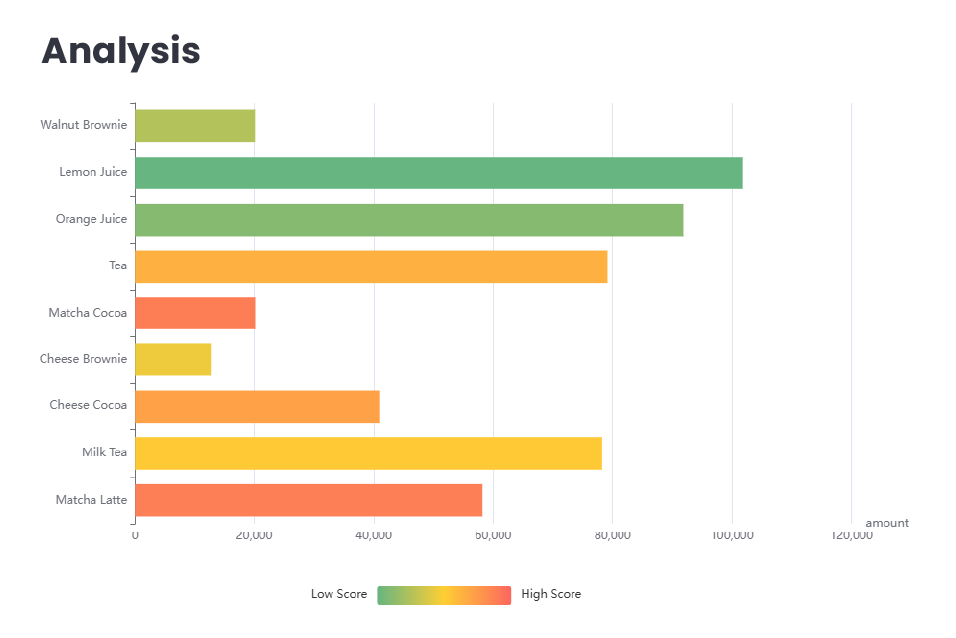
Bar chart
With the AI Graph Maker, bar charts are generated by visualizing data using the length or height of rectangular bars, making it easy to compare data across different categories or time periods. This tool is especially ideal for displaying discrete data, categorical data, and time-series data, enabling clear comparisons between different datasets. Powered by AI, AI Graph Maker quickly produces professional, accurate bar charts, providing powerful support for data visualization.
Flowchart
A flowchart uses graphical symbols to represent the steps of a process or task, making complex workflows easier to understand. With AI Graph Maker, you can quickly create clear and effective flowcharts for various applications, including project management, software development, training, and business process mapping.
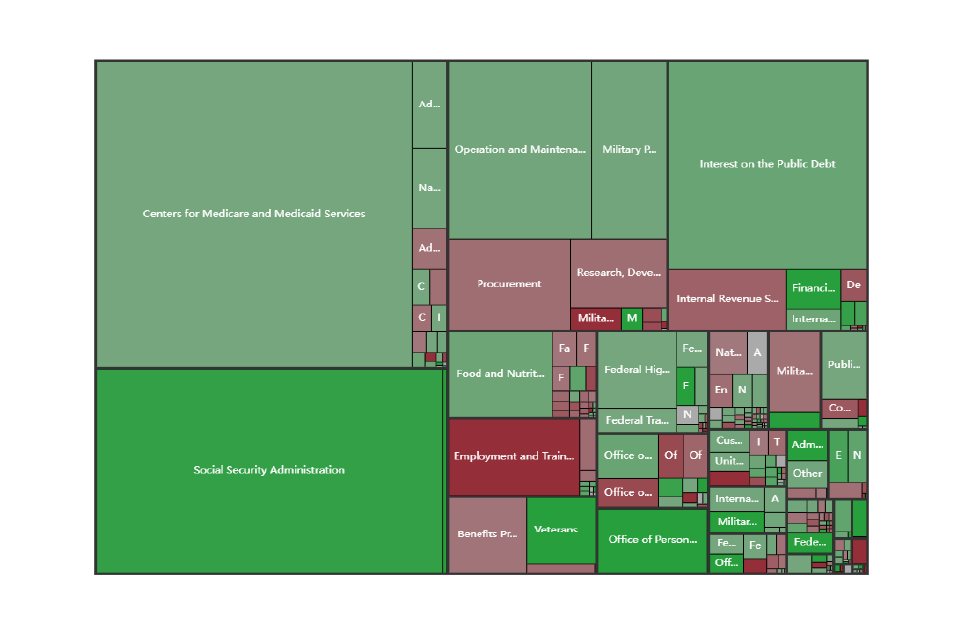
Treemap
With the AI Graph Maker, generate timelines that display events or tasks in chronological order, providing users with a clear view of their schedule. Whether it's for project management, personal planning, historical tracking, or event planning, the AI Graph Maker's timeline feature offers a powerful and intuitive tool for time management. It helps users efficiently plan and control task progress, ensuring that everything is completed on time and improving overall productivity.
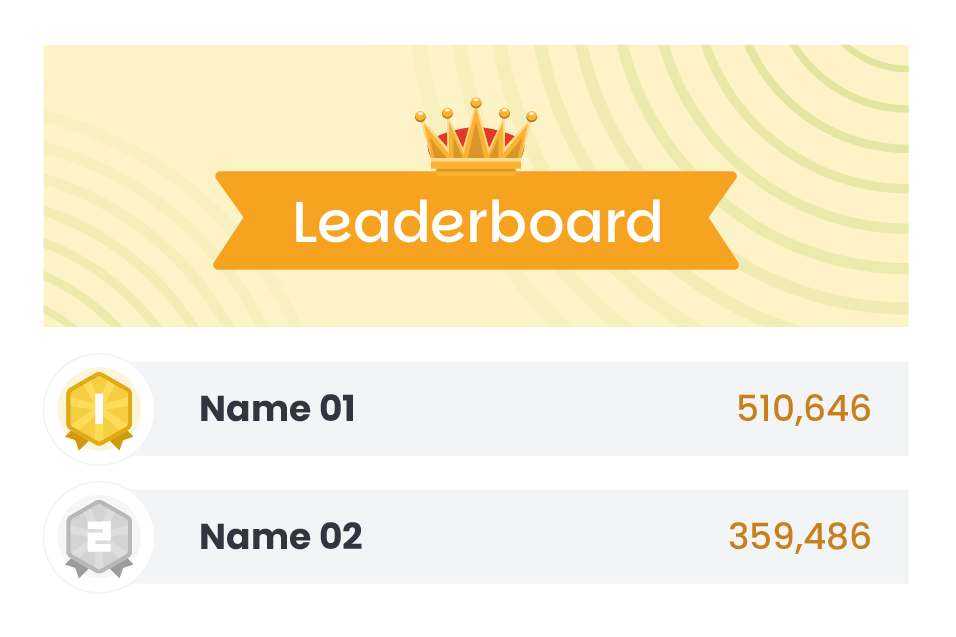
Leaderboard
The AI Graph Maker generates Entity-Relationship Diagrams (ER diagrams), a graphical tool used to describe data models and showcase relationships between entity sets. AI Graph Maker's ER diagrams are widely used in database design, system analysis, object-oriented design, enterprise system modeling, and many other fields. With the help of the AI-powered graph tool, developers can quickly generate high-quality ER diagrams, significantly reducing the time spent on manual diagramming.
Gauge
The AI Graph Maker generates Mind Maps, which visualize the relationships between a central theme and related subtopics. The Mind Maps are commonly used for personal and team activities such as brainstorming, planning, learning, decision-making, and creative work. AI Graph Maker helps users clearly understand complex concepts, efficiently organize and present information, and enhance both thinking efficiency and decision-making quality. With the intelligent chart generation capabilities of AI Graph Maker, users can quickly create structured mind maps that streamline information organization and decision-making processes, boosting productivity.
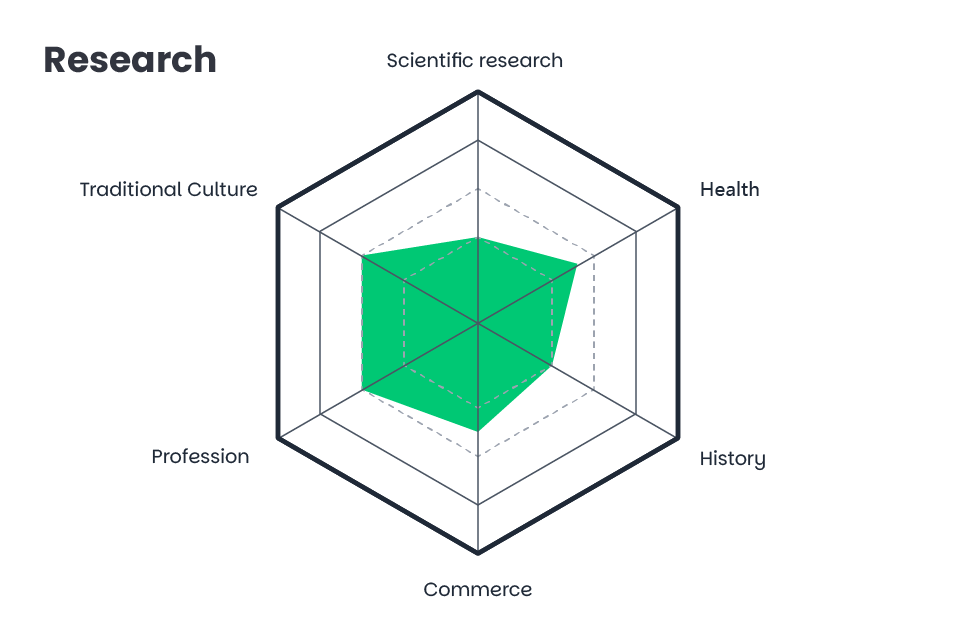
Radar
The AI Graph Maker generates Gantt Charts, a powerful tool that visually displays task progress using bar graphs. It is widely used in fields such as project management, team collaboration, time management, and event planning. Powered by AI technology, the AI Graph Maker automatically creates professional Gantt charts, helping users efficiently plan tasks, track progress, and optimize resource allocation to improve productivity and ensure projects are completed on time.
How to Create a Dashboard with AI Dashboard Design

01
Layout Selection
Choose from a variety of pre-designed dashboard layouts.
02
Themes and color schemes
Personalize dashboards with a range of themes and color schemes, or change your layout or text.
03
Generate Your Chart
Drag & drop the elements into you dashboard and generate your chart with AI widget in the dashboard.
04
Edit the Dashboard
Customize text,, layout, information, labels, and other elements of in your dashboard.
05
Use and Share
So you can use your dashboard or share it with others.
Custom layout
With Custom Layout, you can break free from traditional constraints, creating unique and engaging layouts that stand out, whether for web design, print media, or any creative project requiring a distinctive touch.
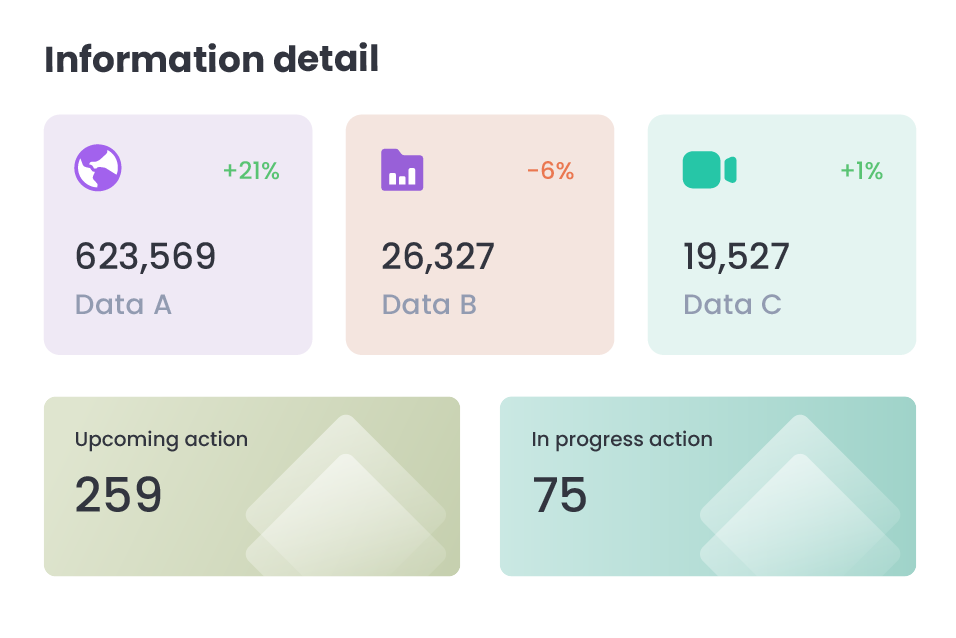
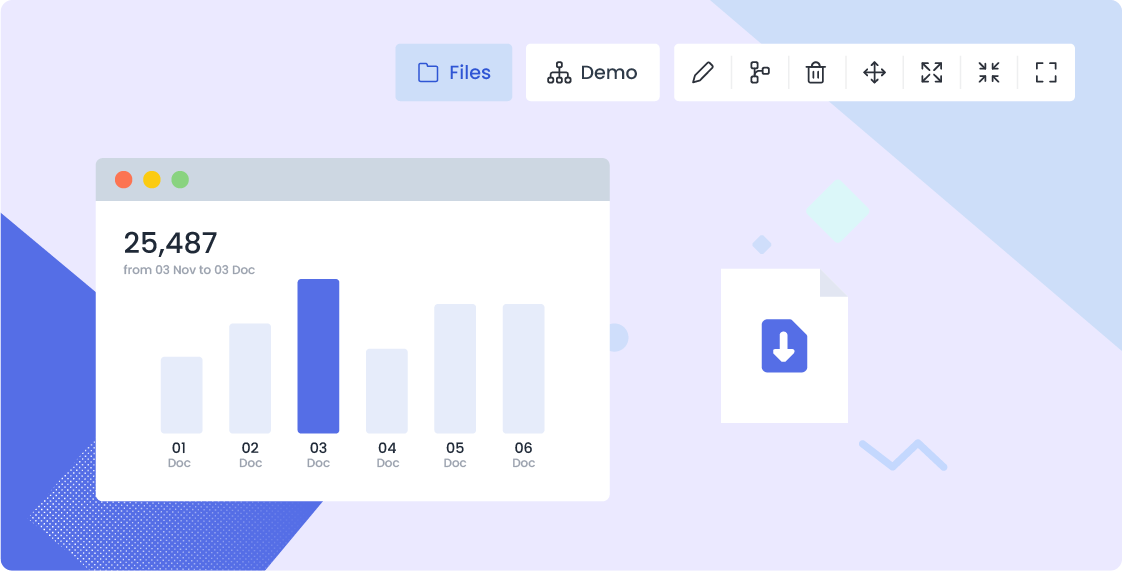
Dashboard Component
These components, ranging from charts and graphs to gauges and alerts, are designed to offer real-time insights, enabling users to monitor key performance indicators and make data-driven decisions with ease.
Data Architecture
This visualization technique is invaluable in fields like computer science, data analytics, and information architecture, as it helps professionals to identify patterns, optimize algorithms, and communicate data-driven insights effectively
Dashboard Builder
Visual Dashboard Builder is a powerful tool that offers fine-grained control over interface details, allowing users to customize every aspect of their dashboards with precision, from layout configurations to color schemes and typography.
FAQs for AI Dashboard Design
01
How do I choose a layout for my dashboard?
To select a layout, navigate to the "Layout" section in our Dashboard Builder. You'll find a variety of pre-designed templates to choose from. Simply click on your preferred layout, and it will be applied to your dashboard canvas, ready for customization.
02
Can I change the style or theme of my dashboard?
Absolutely. In the "Style" section, you can choose from a range of themes and color schemes to match your brand or personal preference. Customize the look and feel by adjusting the background, text colors, and other stylistic elements to create a cohesive and visually appealing dashboard.
03
How do I select and add components to different blocks on my dashboard?
To add or change components, click on the block where you want to add a component. A menu will appear with various options such as charts, tables, and other data visualizations. Choose the component you want to add, and it will be inserted into the selected block. You can then customize the component's data and appearance as needed.
04
What types of charts and graphs are available in the Dashboard Design?
Our Dashboard Builder offers a wide range of chart types, including line charts, bar charts, pie charts, scatter plots, radar charts, tree diagrams, sunburst charts, Sankey diagrams, and funnel charts. You can select the chart type that best represents your data and display it in your dashboard.
05
How does the AI input box work for generating statistical tables?
The AI input box simplifies the data entry process. You simply type in your data or data queries in natural language, and our AI engine parses the input to generate the corresponding statistical tables and charts. This feature is designed to save time and reduce the complexity of manual data entry, making it easy for users to create visualizations without needing extensive data processing skills.
06
Can I customize the appearance of the charts and data in my dashboard?
Yes, our Dashboard Builder allows you to customize the appearance of each chart and information. You can adjust properties such as colors, axes, labels, and more to ensure that your visualizations are not only informative but also align with your dashboard's overall design and style. This level of customization helps in making your dashboard both functional and aesthetically pleasing.